University student voting statistics
A survey from the Higher Education Policy Institute (Hepi) and YouthSight suggests the UK's student non-voter problem is a myth. So why do we keep talking about it?
 We’ve all heard the claims that voter turnout amongst young people is worryingly low. In fact, concerns about low student voter turnout has even resulted in a last minute amendment to the Higher Education Bill that will see unis obliged to play their part in getting students on the electoral register so they vote in university towns.
But whilst young voter turnout is undeniably an issue, experts over at Higher Education site Wonkhe say that associating this with student votes paints a misleading picture.
The non-voting student myth
Wonkhe claim that a ‘critical category error’ is being made time and again when looking at voter stats during elections, as they have a habit of confusing students with ‘young people’ more generally.
A closer look at figures suggests that, in fact, whilst young voter turnout is low, students are turning out in droves on voting days.
The HEPI study found that as much as 82% of students say they're pretty much certain to vote on 8th June and a massive 93% said they’d already registered to do so.
When we look at figures from the 2015 general election, student voter turnout was 69%, whereas the 18-24 average was only 58%.
Similarly, 87% of students turned up to vote in the EU referendum last year, whereas the 18-24 average for the same vote was only 64%.
Therefore, it seems that young people who are not at university are the least represented in UK general elections, not students.
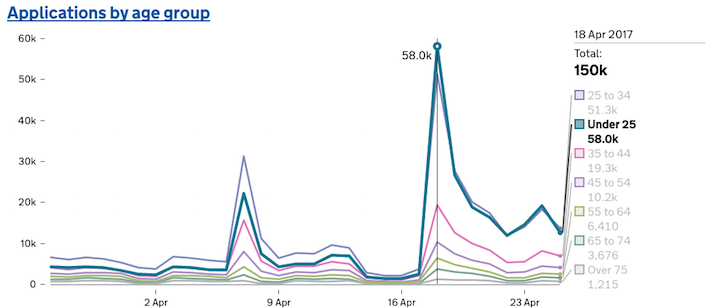
However, it's worth mentioning that things are looking more positive for this election, as 58,000 under 25s registered to vote the day after June's snap election was announced last month (higher than any other age group).
 Credit: Gov.uk
Who did students surveyed say they’d vote for?
According to HEPI's student survey, Labour are currently holding fort as the most popular political party amongst students. In second place were the Conservatives, but only by a third of Labour’s potential votes.
How student plan to vote, according to the survey:
- Labour - 55%
- Conservatives - 18%
- Lib Dems - 12%
- Greens - 6%
- SNP - 3%
- UKIP - 2%
Interestingly, despite 18% of students saying the Tories would get their vote on June 8th, only 5% said they thought the party was good for students, suggesting many students are voting more with life after graduation in mind. This contrasts with how many thought that Labour had good intentions for students (40%), and the Greens (10%).


